
This is part 2 of our series: A Beginner’s Guide to Understanding Location Intelligence. This series of articles introduces the concept of Location Intelligence, explores its applications and examines its potential.
Scenario: Reducing Cardiovascular Disease Risk in a Population (Fictitious example)
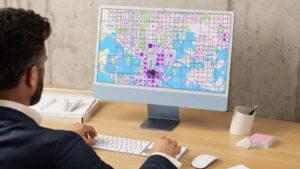
In this fictional scenario, public health department in Espoo, a municipality in Finland, seeks to reduce the prevalence of cardiovascular diseases (CVD). The goal is to identify neighbourhoods with the highest risk and implement targeted preventive measures to improve health outcomes and reduce healthcare costs. Research has informed the department of the factors that contribute to CVD, and how it manifests differently in different communities. To identify these neighbourhoods, the department will overlay multiple types of data on a map to pin-point specific location for targeted intervention. They execute this project in 4 steps:
STEP 1: Data Collection
The healthcare department collects data from various sources, that will help them uncover high risk CVD prevalence areas and inform health promotion strategies to reduce the prevalence. The following data is collected:
| TYPES OF DATA | SOURCE | DESCRIPTION |
| Health and Lifestyle Data | Finnish Institute for Health and Welfare (THL) | Data on obesity rates, smoking prevalence, physical activity, and blood pressure across neighborhoods. |
| Population and Socioeconomic Data | Statistics Finland | Data on population, income, employment, education, and household composition to analyze socioeconomic disparities and their link to cardiovascular risk. |
| Sensory Data | Finnish Environment Institute (SYKE), Espoo Environmental Services | Data on air quality, pollution levels, and access to green spaces to identify environmental risk factors for cardiovascular disease. |
| Geospatial Data | National Land Survey of Finland (Maanmittauslaitos), Espoo’s open data platform | Geographic data on the locations of parks, fitness centers, healthcare facilities, fast-food restaurants, and grocery stores to assess the accessibility of health resources. |
| Genomic Data | FinnGen | Genetic information of individuals, which can include whole-genome sequencing, genotype data, or specific genetic markers. This data helps identify genetic variants that may be associated with increased CVD risk or health conditions. |
STEP 2: Anonymization
In Finland, all citizens have a unique personal identification number (PIN), which allows for precise linkage of different datasets. Genomic data from biobanks can be linked to health and demographic data stored in national health databases using this identifier, without revealing the participant’s identity.
Before integration, data is de-identified to protect individuals’ privacy. The PIN is replaced by anonymized codes in both the genomic and population datasets. The anonymized datasets are linked based on the unique identifiers. This linkage allows researchers to combine genetic data with health, lifestyle, and demographic information for analysis without compromising privacy.
STEP 3: Data Harmonisation and Integration
Data from different sources (e.g., health records, genetic data) are often in various formats. Harmonization ensures that variables like age, disease codes (e.g., ICD-10), and genetic markers are standardized so they can be analyzed together. Tools and databases like the Finnish Institute for Health and Welfare (THL) ensure that data across health records and genomic datasets follow common standards.
Data integration step ensures data can be connected and analyzed. This means e.g. linking statistical data with administrative units like municipalities, use of geocoding (like co-ordinates, addresses) or use of persistent identifiers.
The integrated datasets are cleaned to remove inconsistencies, missing values, or errors that could affect the analysis.
Step 4: Cross-layer Analysis
Once integrated, multi-layer data can be analyzed in tandem, as shown in the image below:
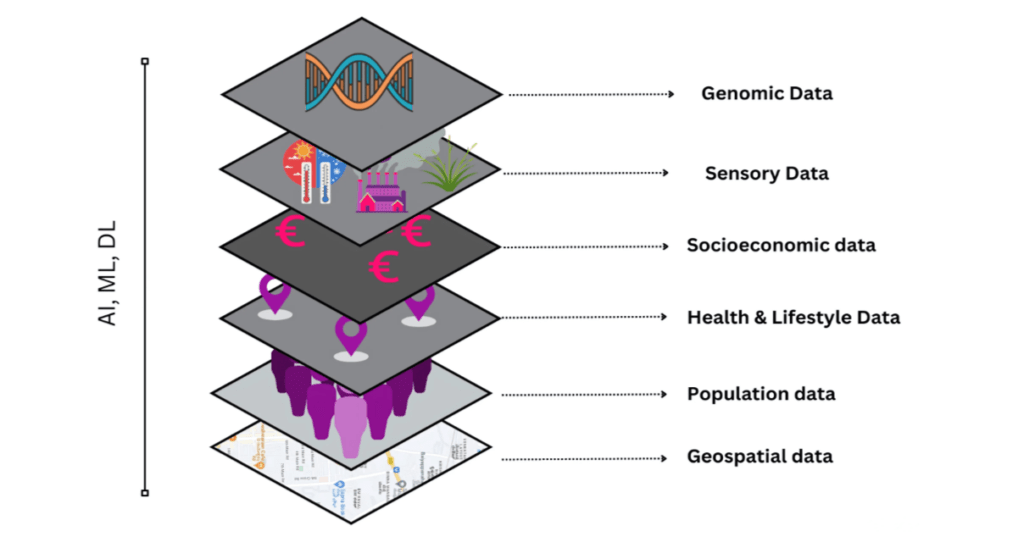
The healthcare department carries out the following cross-layer analyses:
- Genomic Layer: Analysis of genetic variants associated with diseases.
- Health and Lifestyle Layer: Analysis of population-level health outcomes (e.g., incidence of cardiovascular disease, diabetes) and how they relate to factors such as diet, exercise, or medication usage.
- Environmental and Socioeconomic Layer: Analysis of how socioeconomic factors (e.g., education, income) and environmental exposures (e.g., pollution, urbanization) influence health outcomes and interact with genetic predispositions.
Using GIS software, the city’s public health department integrates multiple layers of data to identify neighborhoods at high risk for cardiovascular disease.
By layering obesity and smoking prevalence data over income and access to parks, Espoo can target neighborhoods where these factors combine to create elevated CVD risk. Below are the types of analysis the department carries out further:
| Type of Analysis | Purpose | Example |
| Spatial Regression Analysis | Identifies which variables (e.g., lifestyle factors, socioeconomic status) have the strongest correlation with cardiovascular disease prevalence. | The city can use this analysis to link air pollution and proximity to unhealthy food options with elevated CVD risk in communities |
| Predictive Modeling | Uses past data and statistical techniques to predict future cardiovascular disease trends. | Predict future CVD risk based on current obesity, smoking rates, and sedentary behavior patterns. |
| Heat Mapping | Visualizes high-risk areas by overlaying different data layers (e.g., smoking rates, socioeconomic status) on geographic maps. | Heat maps can highlight areas where multiple risk factors, such as high smoking prevalence and poor air quality, coincide. |
| Network Analysis | Analyzes access to healthcare services and healthy lifestyle options by mapping and assessing distances between residents and facilities. | Assess the proximity of high-risk populations to fitness centers or healthcare facilities to inform decisions on where to build new infrastructure in the city. |
| Impact Monitoring | Measures the effect of interventions over time by continually collecting and analyzing new data. | The department can track the outcomes of new bike lanes or parks by monitoring physical activity levels through fitness apps or community surveys. |
Based on the insights gained from location intelligence, the public health department can, together with the city, tailor preventive strategies, including:
Promoting Active Lifestyles: Having identified high-risk neighborhoods, where there is limited access to parks and sports facilities, the city can invest in building new fitness centers or outdoor gyms. Additionally, they can promote cycling and walking by expanding its bike lane network.
Improving Access to Healthy Food: In areas identified as “food deserts,” where access to healthy food is limited, the municipality can incentivize the opening of grocery stores with healthier food options. For example, encouraging grocery stores to open in affected locations or offering subsidies to local markets.
Reducing Air Pollution: The city, using location-based sensory data, can expand green spaces and reduce air pollution in high-traffic neighborhoods by implementing congestion charges and planting more trees to improve air quality.
Monitoring and Measuring Outcomes: The city can continue to collect real-time data and update their maps to monitor the effects of these interventions. The city can use data from mobile apps or fitness trackers (with residents’ consent) to track physical activity levels. This allows the department to see if new bike lanes or parks increase physical activity and reduce CVD risk.
Conclusion
This example illustrates how Location Intelligence (LI) can transform preventive healthcare, enabling public health departments to identify at-risk areas, implement targeted interventions, and monitor their impact over time. By integrating data from diverse sources, our fictitious example of Espoo’s health department demonstrated the power of geospatial analysis in addressing complex health challenges like cardiovascular disease.
This case is just one of the many ways LI is shaping decision-making in various sectors. As we continue this series, we’ll explore some challenges and considerations related to the use of Location Intelligence, and the future of its use. Stay tuned for the next installment as we dive deeper.
Location Innovation Hub is a centre of expertise for location information and technology, offering free coaching for small and medium-sized enterprises and public administrations. We provide support in areas like business development, adopting new technologies and finding funding opportunities. Contact us to find out more about our free services!